“Stay hungry. Stay foolish.”
In my last post, I talked a little bit about learnt clause size distributions (histograms, really), and after a long chat with Vegard Nossum, we came up with some nice 3D graphs of learnt clause size distributions et al. It’s basically a lot of brainstorming that is quite entertaining I think. First of all, instead of waiting for Godot (i.e. someone to tell me that is has been done already), we got down an dirty with time-sliced histograms, so we can see how a specific problem gets solved. Again, I won’t go into much analysis, as I think it’s quite detrimental to novel ways of interpretation, instead, I will simply display the graphs. All simplification algorithms have been switched off for these graphs, though interestingly, they look pretty similar even if simplifications are turned on. Before we start, let me note that all tools to generate these simply and easily will be available in CryptoMS-2.9.2 (and are already available from the git repository of course — nothing I do on CMS is secret)
Grain
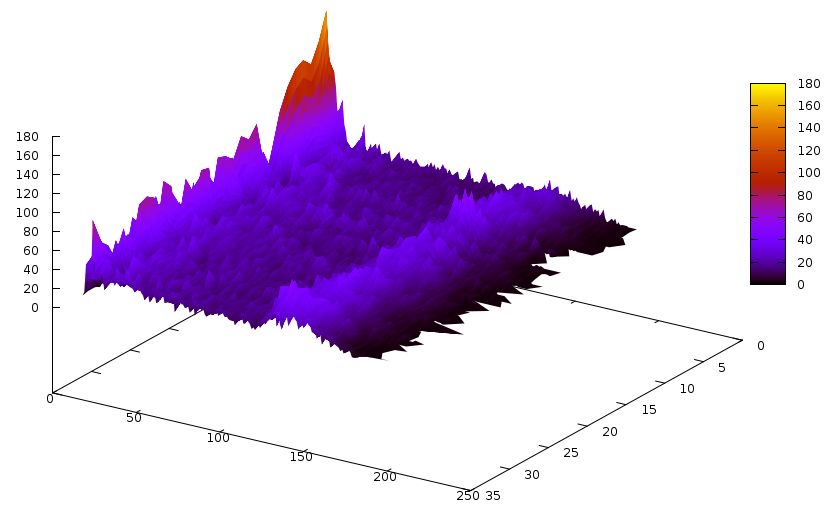
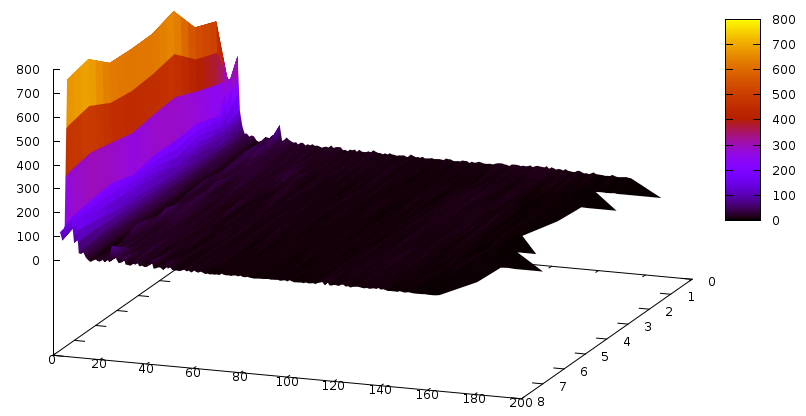
Let’s first start with the Grain cipher — we have seen it before and it had quite a peculiar shape. The learnt clause size distribution for this cipher is the following:
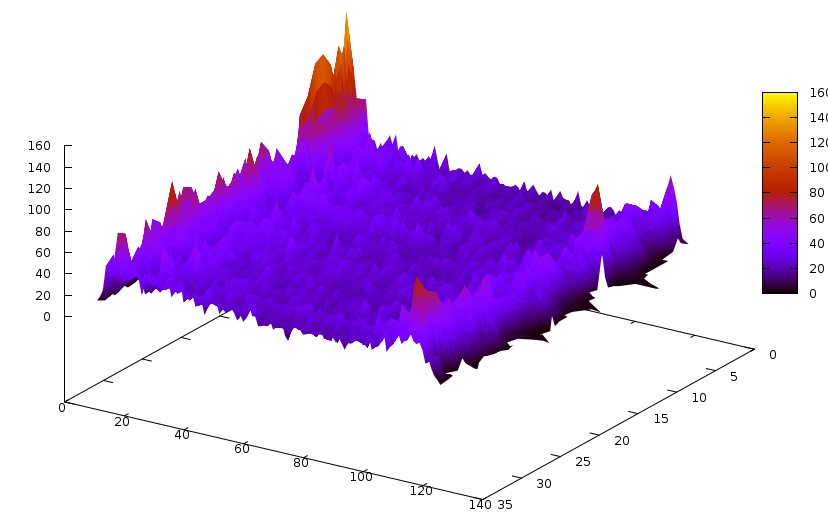
The Z axis contains the slices– one slice is 3’000 conflicts, and time flows from the back to the front (we didn’t solve the instance).The Y axis is number of clauses, and X axis is the size of the clause. Notice the bump around clause size ~130. An interesting graph would now be to compare this with glues of these clauses… so it goes:
Pretty similar, actually, except that the bump is around 110. Now, this bump could be fully useless. Or the holy grail. We don’t know… until we see some graphs ;) The graph for propagations caused by learnt clauses of specific sizes is the following:
The Z axis here is a bit different: it accumulates 3’000 propagations caused by learnt clauses, and then generates a slice. That’s the reason there are 600 of them in contrast to the one above, where there are 33 (for ~100’000 conflicts). Notice that most of the propagations are caused by small clauses. The same for glues:
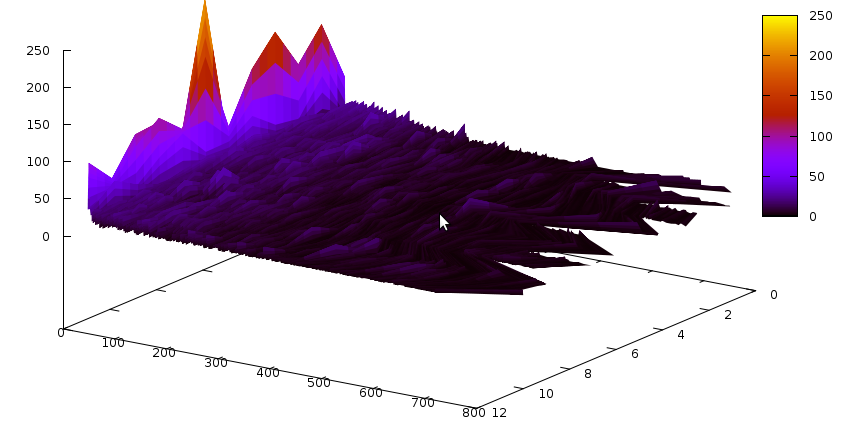
Now the number of conflicts caused by learnt clauses of specific sizes:
Notice the slight colourchange on this graph at around 130 — compared to the previous 2 graphs, conflicts are done by a relatively good number of longer clauses, too. Let’s do the same with glues now:
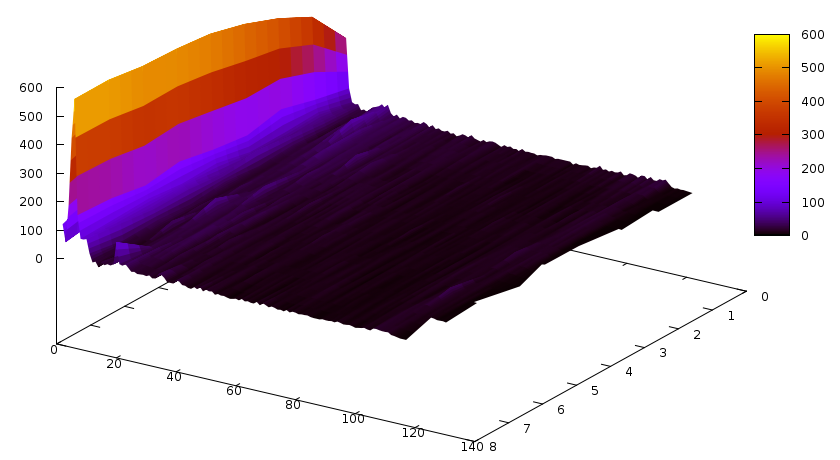 Colourchange (and a bit visible bump, too) at around 110. Actually, it might be best to put the Y axis into logscale… next time.
ACG-20-10p0
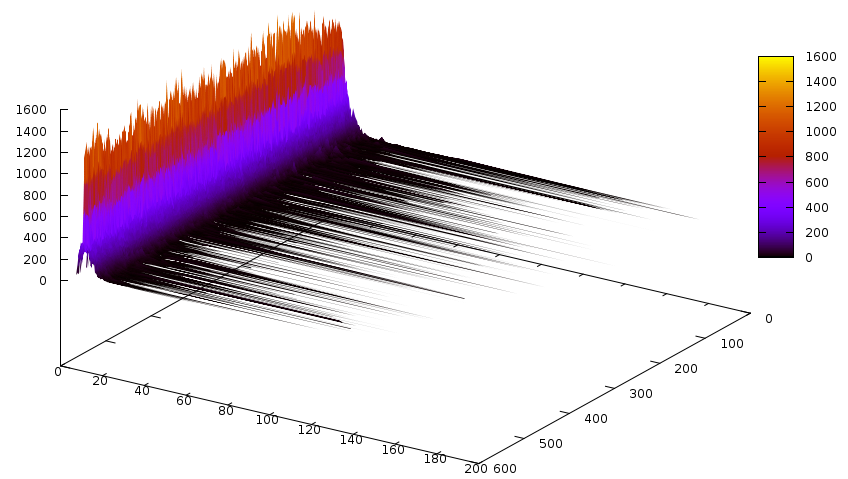
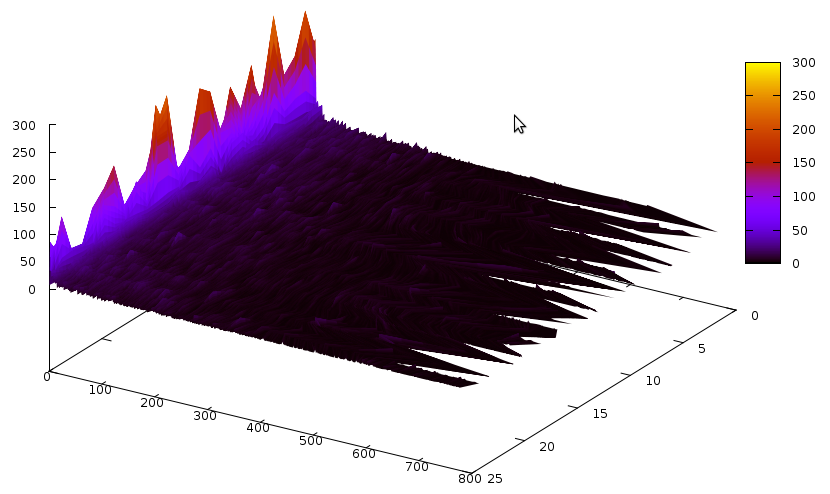
Now that we have gone through Grain, let’s try another problem. For example the ACG-20-10p0 problem from SAT Comp’09. The clause size distributions are now:
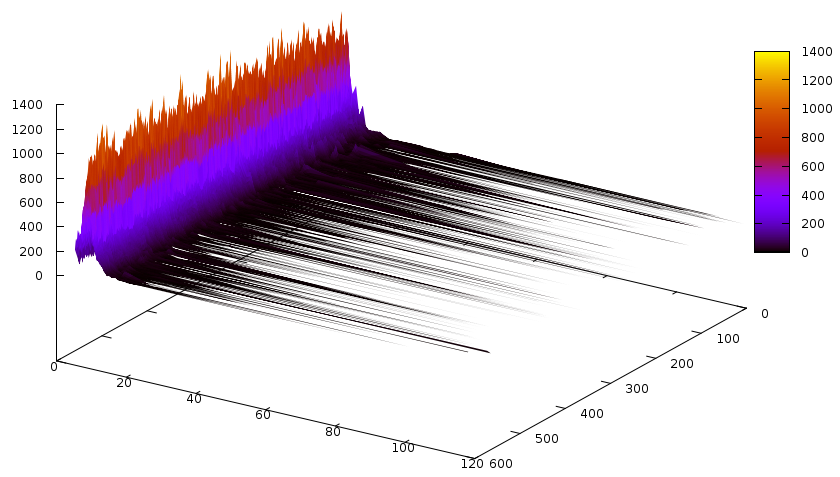
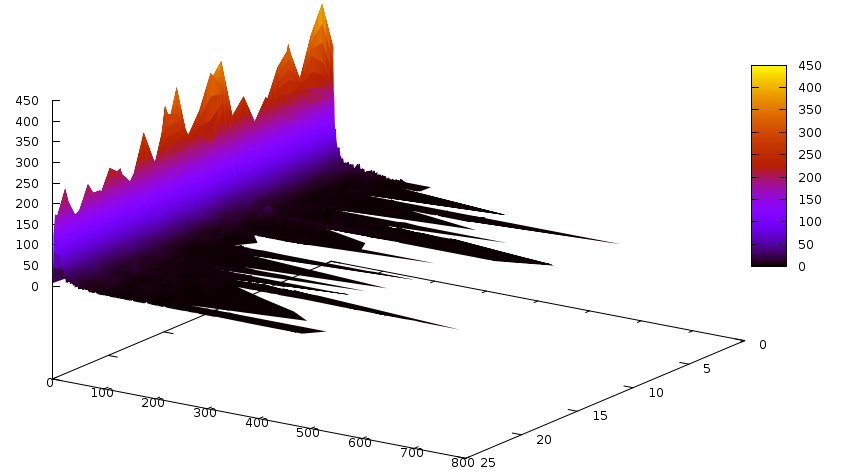
And the same for glues:
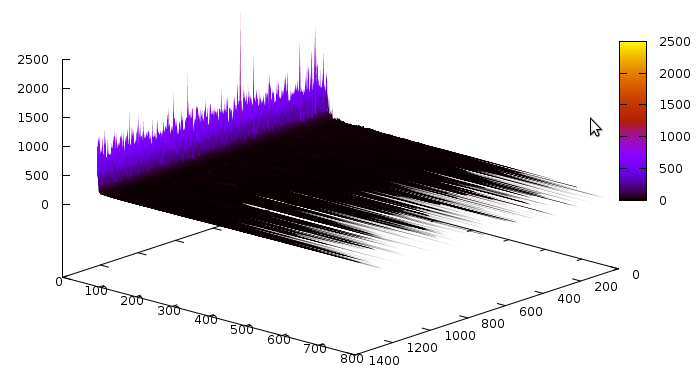
And the propagations according to their size:
Notice that the number of slices is quite large. Now the conflicts caused by learnt clauses, according to their size:
Notice that compared to the previous graph, the distribution is shifted a lot more towards longer clauses, similarly to the Grain example. Also notice that there were 25 slices in total, and 12 slices’ worth of conflicts were caused by learnt clauses — in other words, about 50% of all conflicts are caused by learnt clauses. I was aware of this behaviour because CryptoMS 1.0 had a statistical interface, where this was quite obvious to see — unfortunately, that statistical interface is gone now, but may be back in one form or another in CryptoMS 3.0.0. For Grain, we had 33 slices, and 8 slices’ worth were caused by learnt clauses, which is not 50% but still pretty high, considering that the number of learnt clauses is usually far less than the number of original clauses.
A lot of thanks go to Vegard Nossum for all of this. He was the one who inquired about producing these using the new CryptoMiniSat, and once I put the ~5 lines of code into the solver and wrote a hackish awk script, he wrote the perl script to parse the data up, and showed me the beautiful results. I just couldn’t wait to share them with you :)
